Exploring House Points in Harry Potter
Earlier during the pandemic my wife and I re-watched all of the Harry Potter movies. One thing that bugged me during the re-watch was the seemingly inconsistent nature of house cup points. Sometimes it seemed like minor things would give huge point awards, and vice versa. But was that actually true? How were house points awarded in Harry Potter?
Thankfully, because of Bradley Boehmke’s harrypotter package, we can answer this question! The package loads character vectors for each book.
library(harrypotter)
library(tidyverse)
## -- Attaching packages --------------------------------------- tidyverse 1.3.0 --## v ggplot2 3.3.2 v purrr 0.3.4
## v tibble 3.0.4 v dplyr 1.0.2
## v tidyr 1.1.2 v stringr 1.4.0
## v readr 1.4.0 v forcats 0.5.0## -- Conflicts ------------------------------------------ tidyverse_conflicts() --
## x dplyr::filter() masks stats::filter()
## x dplyr::lag() masks stats::lag()library(tidytext)
library(ggridges)We’ll load all of the books into a list, then use map2_dfr to turn each into a tibble, add the book name as a column, and trim the actual text.
hp_books <- list(philosophers_stone, chamber_of_secrets, prisoner_of_azkaban,
                 goblet_of_fire, order_of_the_phoenix, half_blood_prince,
                 deathly_hallows)

books_vec <- c("philosophers_stone", "chamber_of_secrets", "prisoner_of_azkaban",
                 "goblet_of_fire", "order_of_the_phoenix", "half_blood_prince",
                 "deathly_hallows")

names(hp_books) <- books_vec

hp <- map2_dfr(hp_books, names(hp_books),
               ~ tibble(text = .x) %>%
                  mutate(book = .y,
                         text = str_trim(text)))
Next we can use the tidytext package to unnest each sentence into a separate row, add columns for the sentence number and whether "point*" is detected in the sentence.
## unnest by sentence (all books)
points <- hp %>%
    unnest_tokens(sentences, text, token = "regex",
                  pattern = "(?<!\\b(Mr|Mrs|Ms))\\.") %>%
    group_by(book) %>%
    mutate(sentence_num = row_number(),
           point = str_detect(sentences, "point |points"),
           sentences = str_squish(sentences),
           sentences = str_remove_all(sentences, "\t\n\r")) %>%
    ungroup() %>%
    arrange(factor(book, levels = books_vec))
I then exported this as a CSV and went through each line detected as “point” and added more information. You can see the resulting dataframe below:
hp_points <- read_csv("C:\\Users\\ChadPeltier\\Downloads\\hp_points_coded.csv") %>%
    mutate(book = factor(book, levels = books_vec),
           direction = if_else(num_points > 0, "positive", "negative"))

hp_points %>%
    head(5)
## # A tibble: 5 x 12
## book sentences sentence_num point actual_point num_points points_awarder
## <fct> <chr> <dbl> <lgl> <dbl> <dbl> <chr>
## 1 phil~ "over th~ 2381 TRUE 1 -1 Severus Snape
## 2 phil~ "\"you -~ 2392 TRUE 1 -1 Severus Snape
## 3 phil~ "\"miss ~ 3046 TRUE 1 -5 Minerva McGon~
## 4 phil~ "five po~ 3097 TRUE 1 -5 Severus Snape
## 5 phil~ "\"five ~ 3333 TRUE 1 -5 Severus Snape
## # ... with 5 more variables: points_subject <chr>, points_house <chr>,
## # reason <chr>, type_of_broken_rules <chr>, direction <chr>Ok, now we can make some charts to analyze how many points were distributed, to whom, by whom, and for what:
## number of positive/negative awards per book
hp_points %>%
    count(book, direction, sort = TRUE) %>%
    mutate(n = if_else(direction == "negative", as.integer(paste0("-", n)), n)) %>%
    ggplot(aes(n, reorder(book, desc(book)), fill = direction)) +
    geom_col() +
    labs(y = "", title = "Number of positive or negative point awards by book")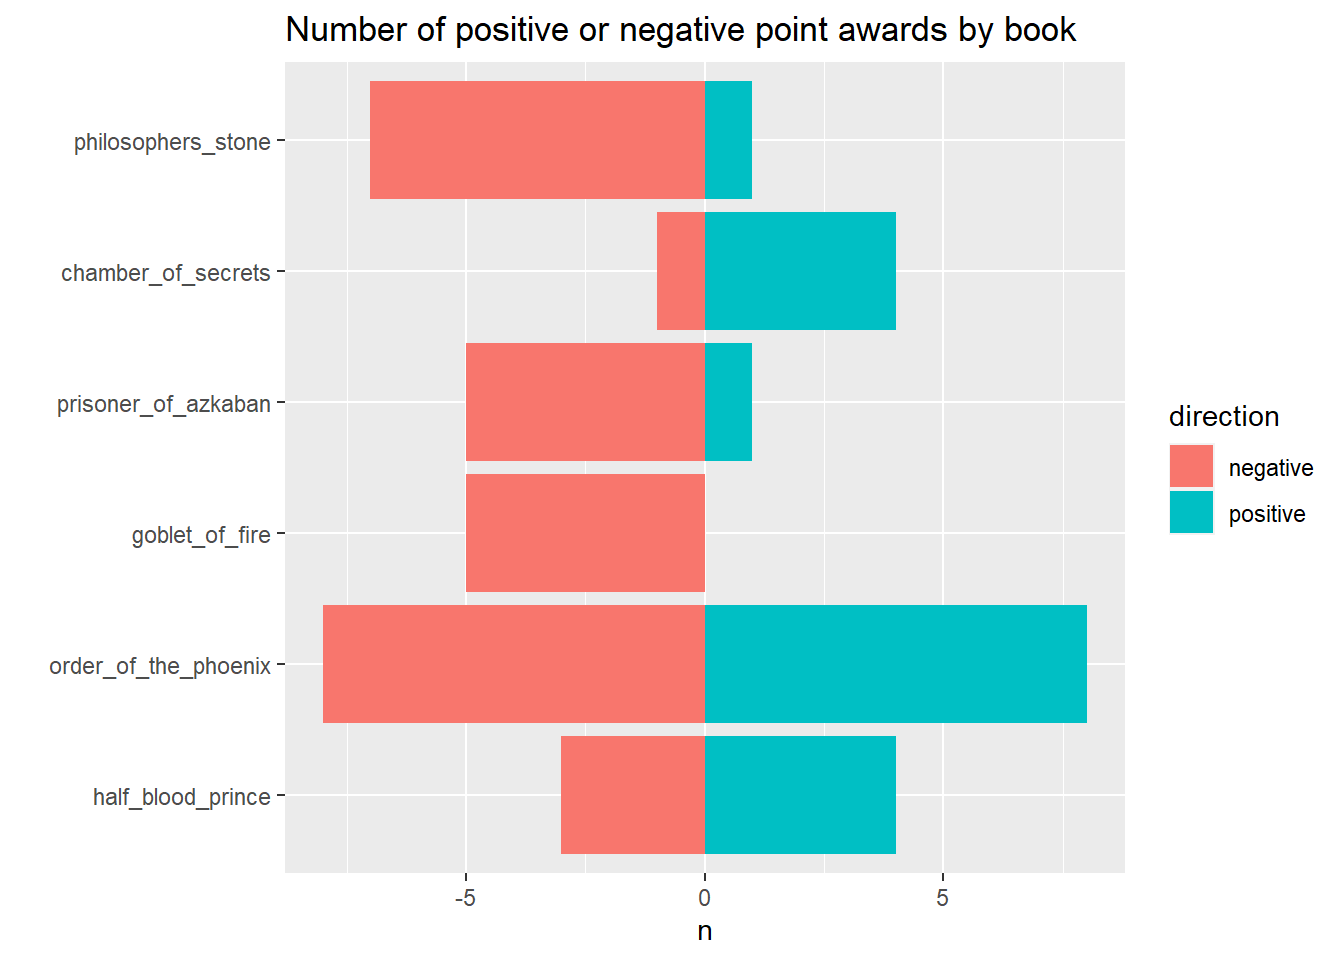
hp_points %>%
    ggplot(aes(num_points)) +
    geom_histogram() +
    ggtitle("Distribution of house point awards")
## `stat_bin()` using `bins = 30`. Pick better value with `binwidth`.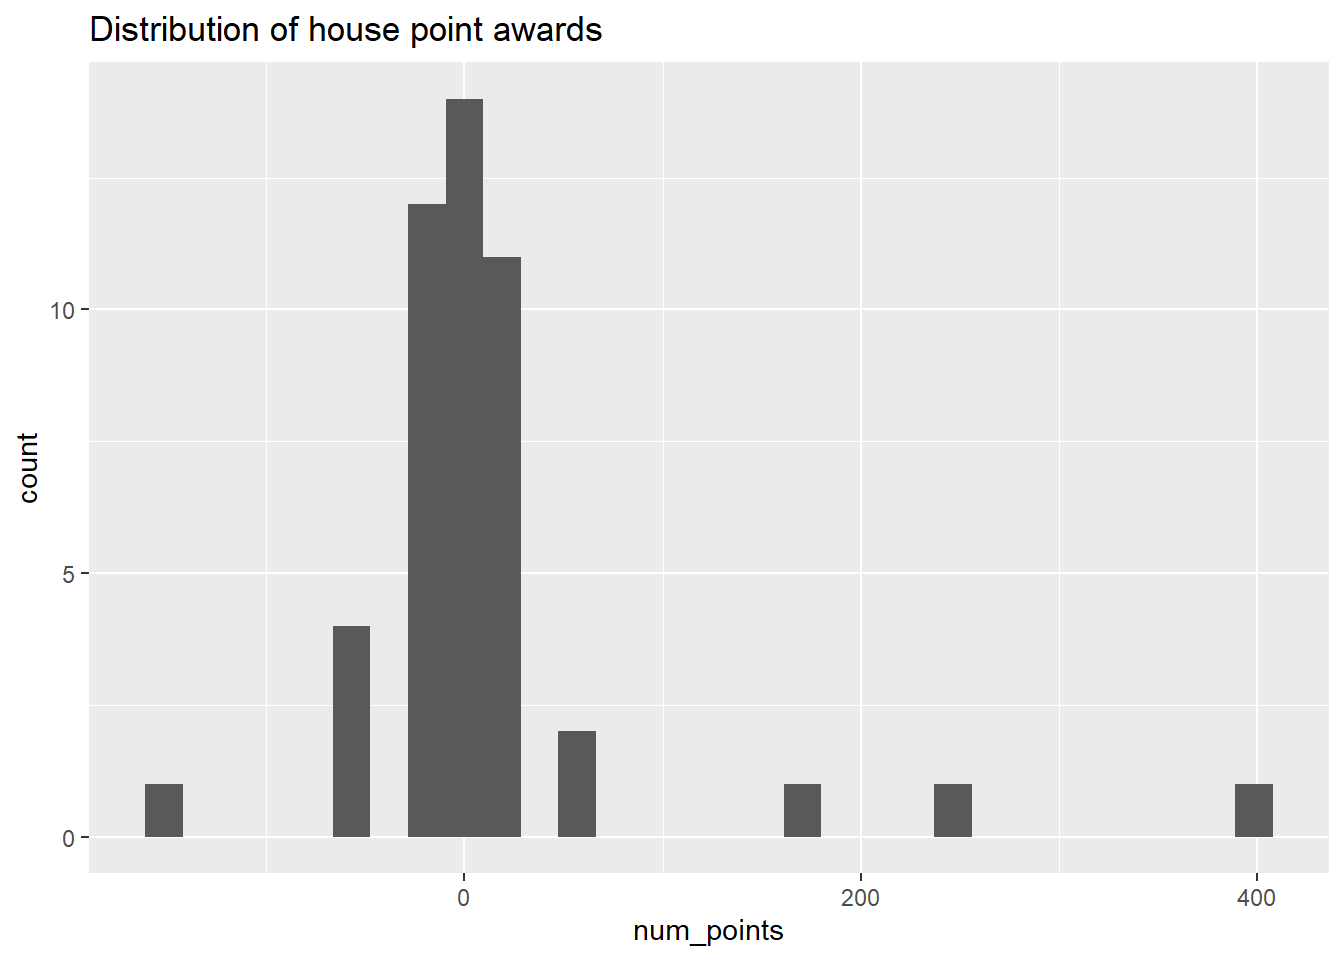
awarders <- hp_points %>%
    count(points_awarder, sort = TRUE) %>%
    filter(n > 2)

# by book
hp_points %>%
    ggplot(aes(num_points, reorder(book, desc(book)), fill = book)) +
    geom_boxplot() +
   # geom_jitter(aes(color = book)) +
    theme(legend.position = "none") +
    labs(y = "", title = "House points by book")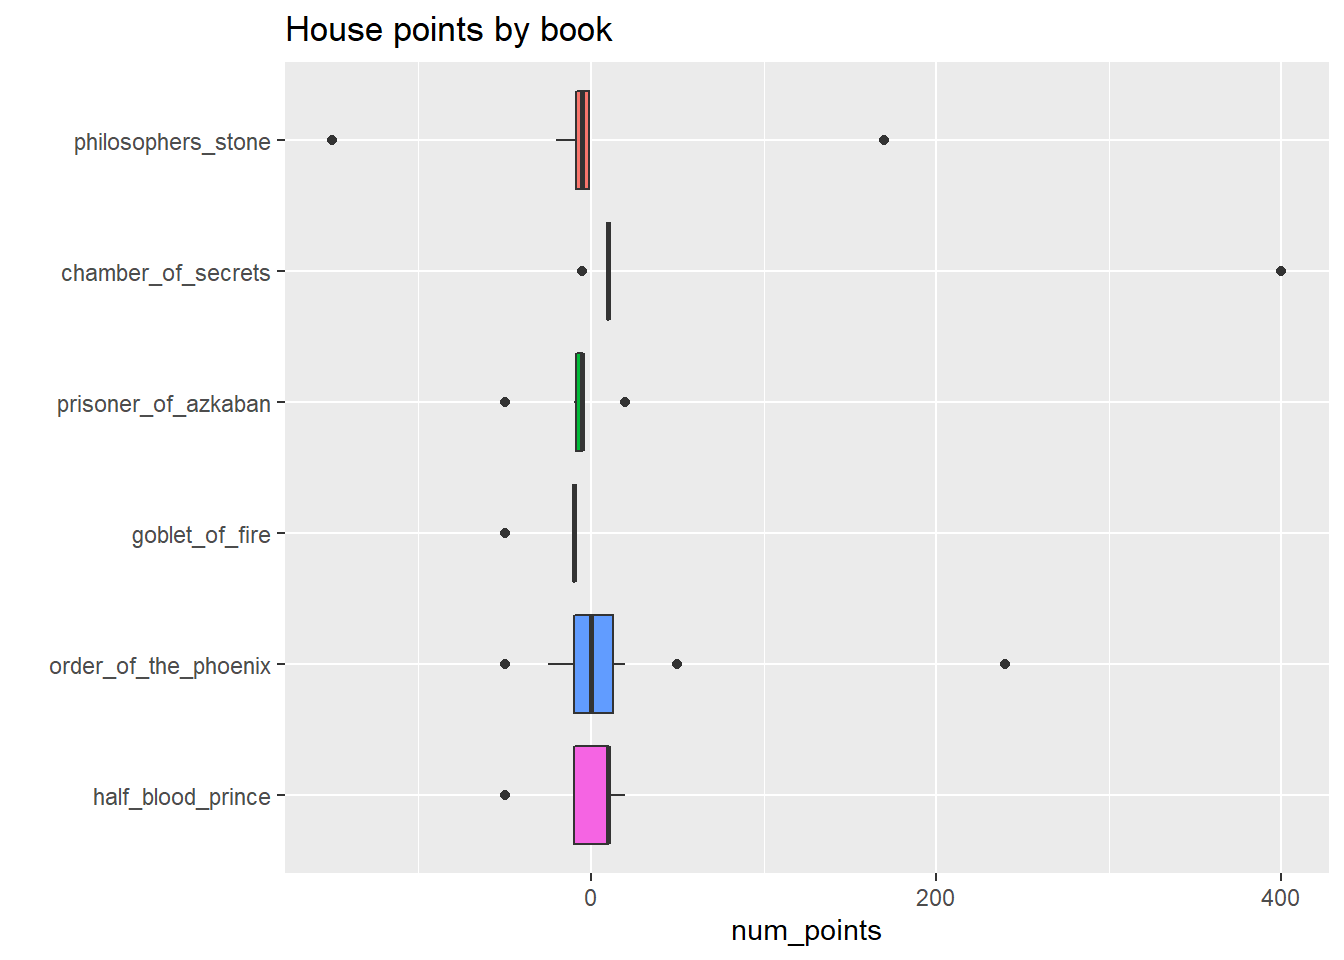
# by reason
hp_points %>%
    ggplot(aes(num_points, reason, fill = reason)) +
    geom_density_ridges() +
    theme(legend.position = "none") +
    labs(y = "", title = "Reasons for house points")
## Picking joint bandwidth of 19.3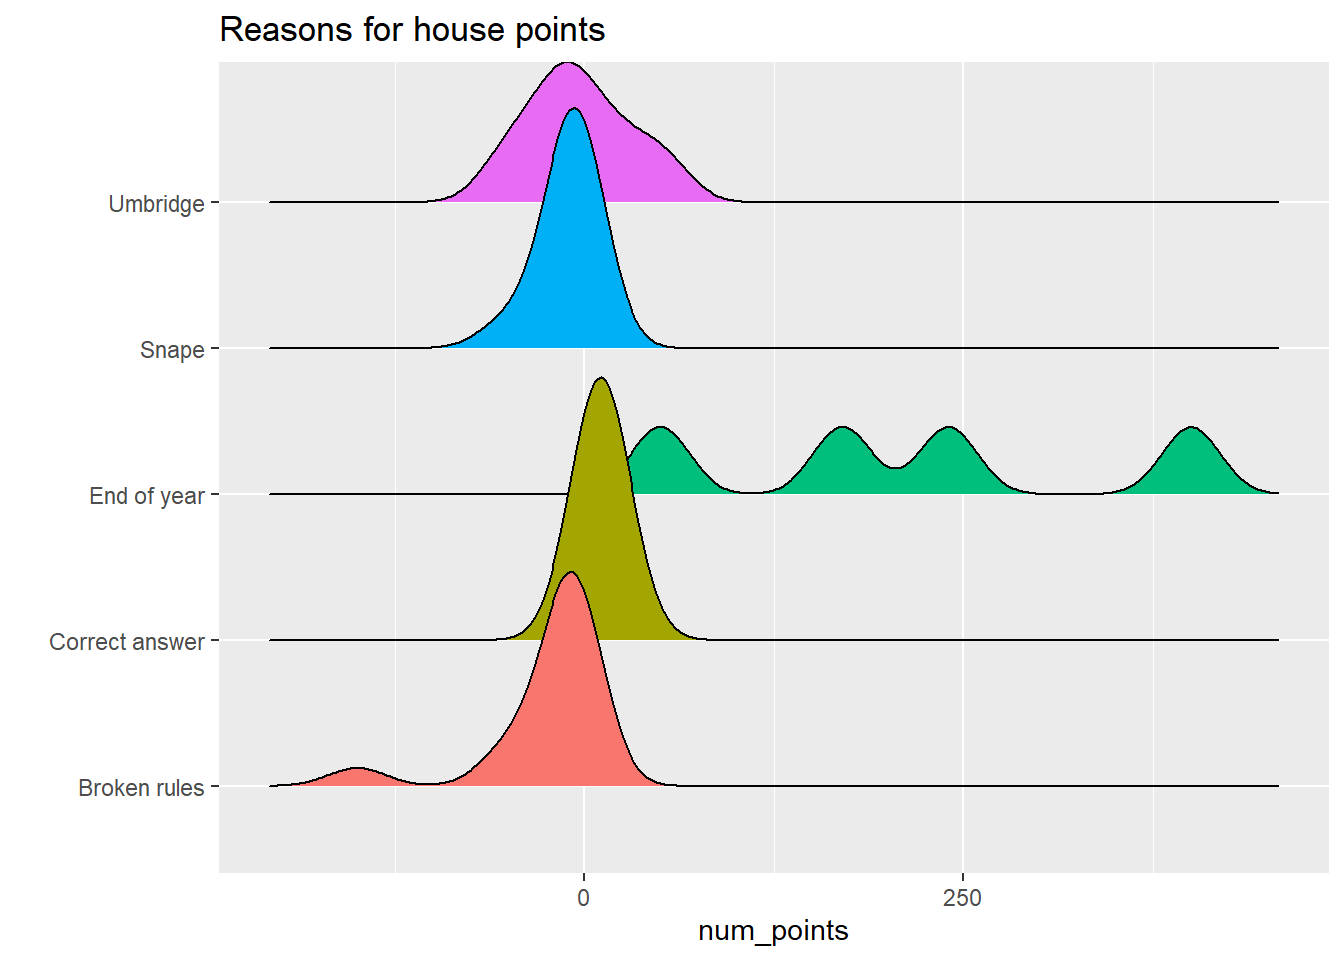
hp_points %>%
    ggplot(aes(num_points, reason, fill = reason)) +
    geom_boxplot() +
    theme(legend.position = "none") +
    labs(y = "", title = "Reasons for house points")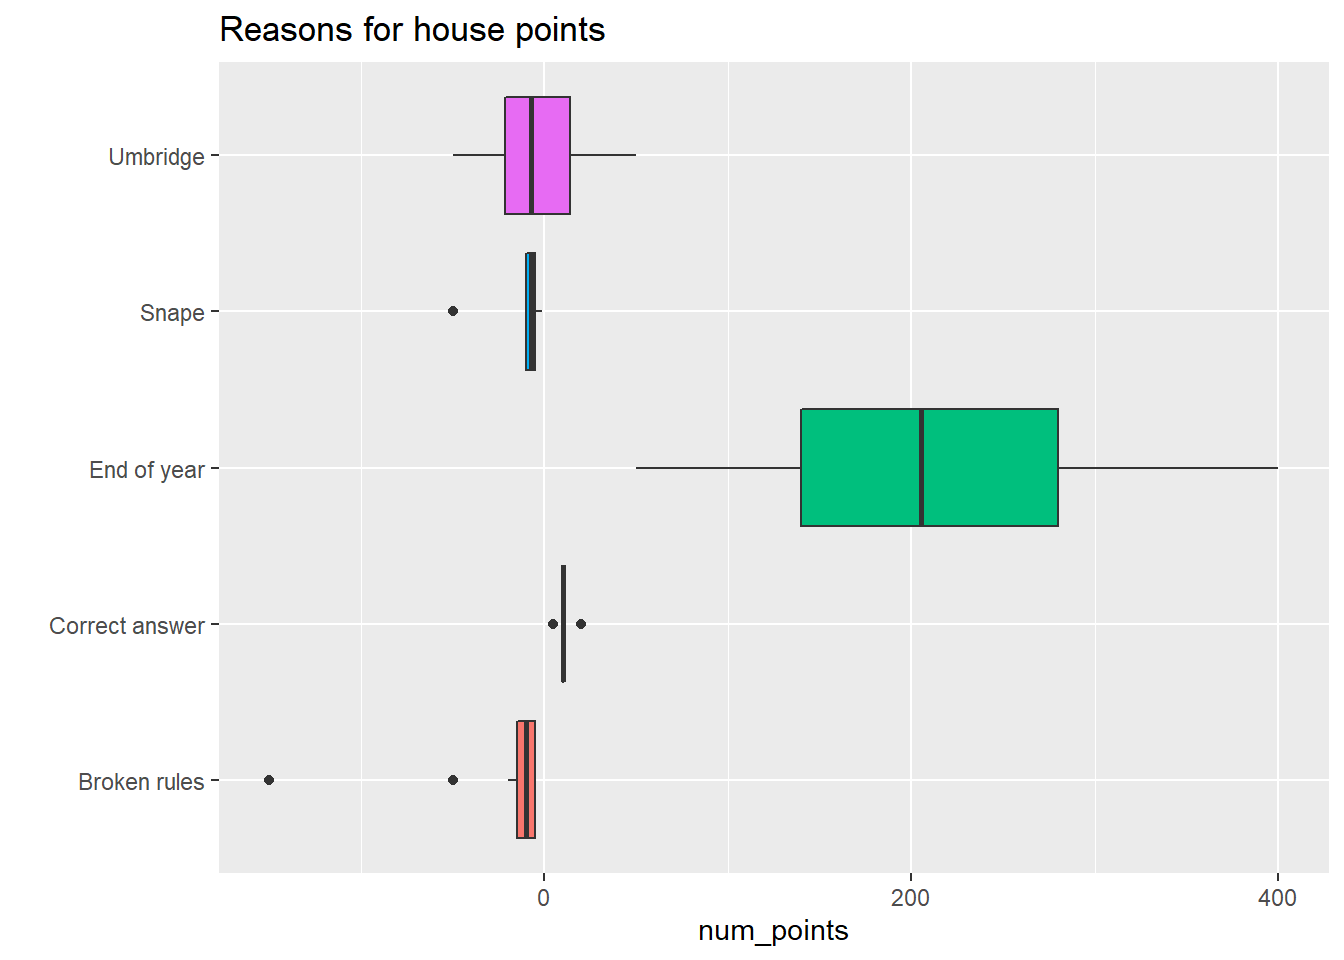
hp_points %>%
    count(reason, sort = TRUE) %>%
    ggplot(aes(n, reorder(reason,n ), fill = reason)) +
    geom_col() +
    theme(legend.position = "none") +
    labs(y = "", title = "Number of awards/subtractions by reason")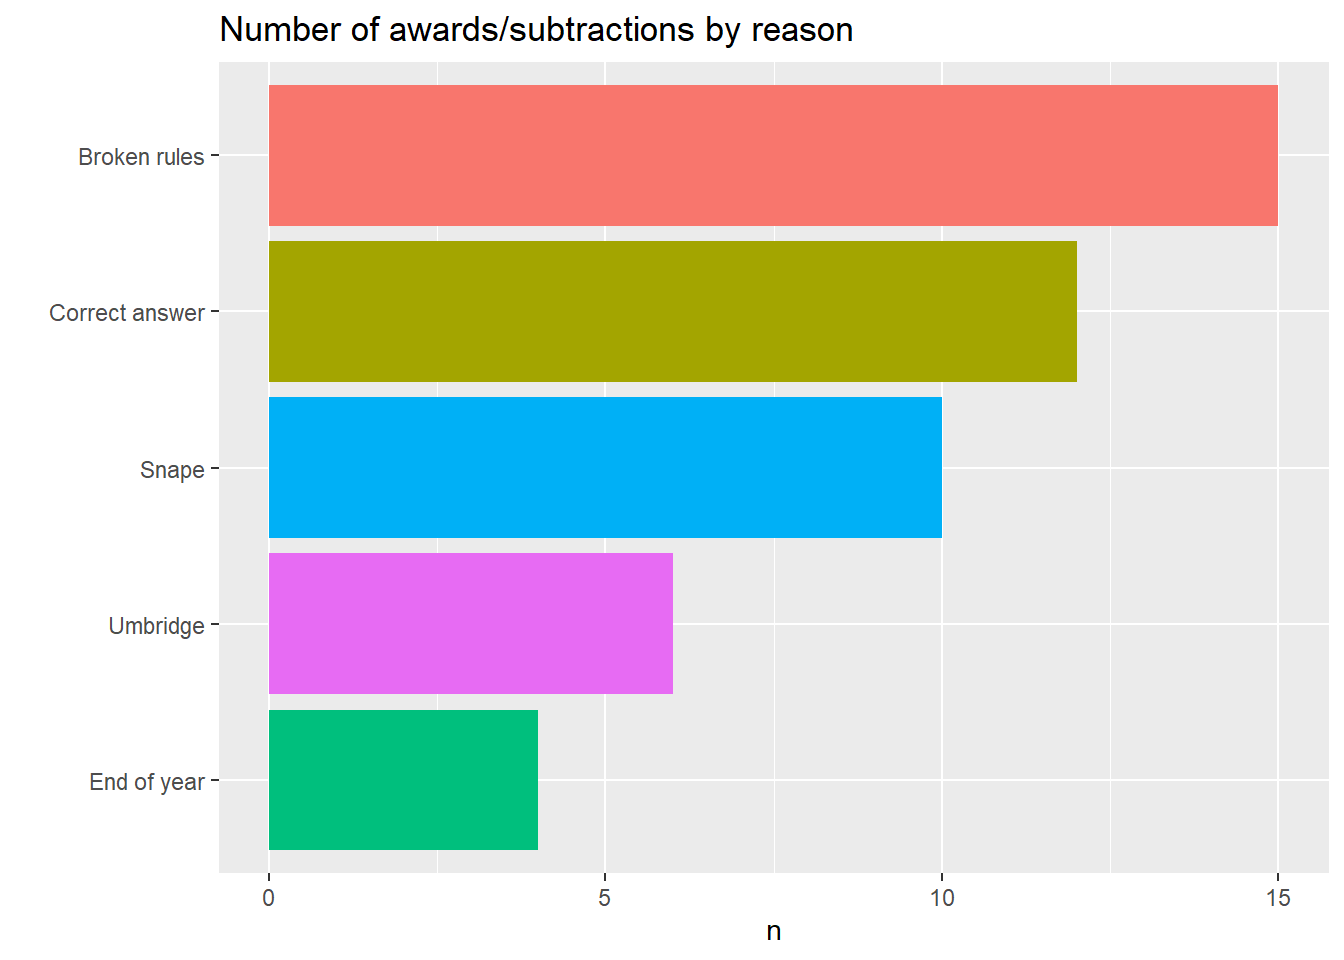
# by awarder
hp_points %>%
    filter(points_awarder %in% awarders$points_awarder) %>%
    ggplot(aes(num_points, points_awarder, fill = points_awarder)) +
    geom_density_ridges() +
    theme(legend.position = "none") +
    labs(y = "", title = "Who awarded points?")
## Picking joint bandwidth of 6.64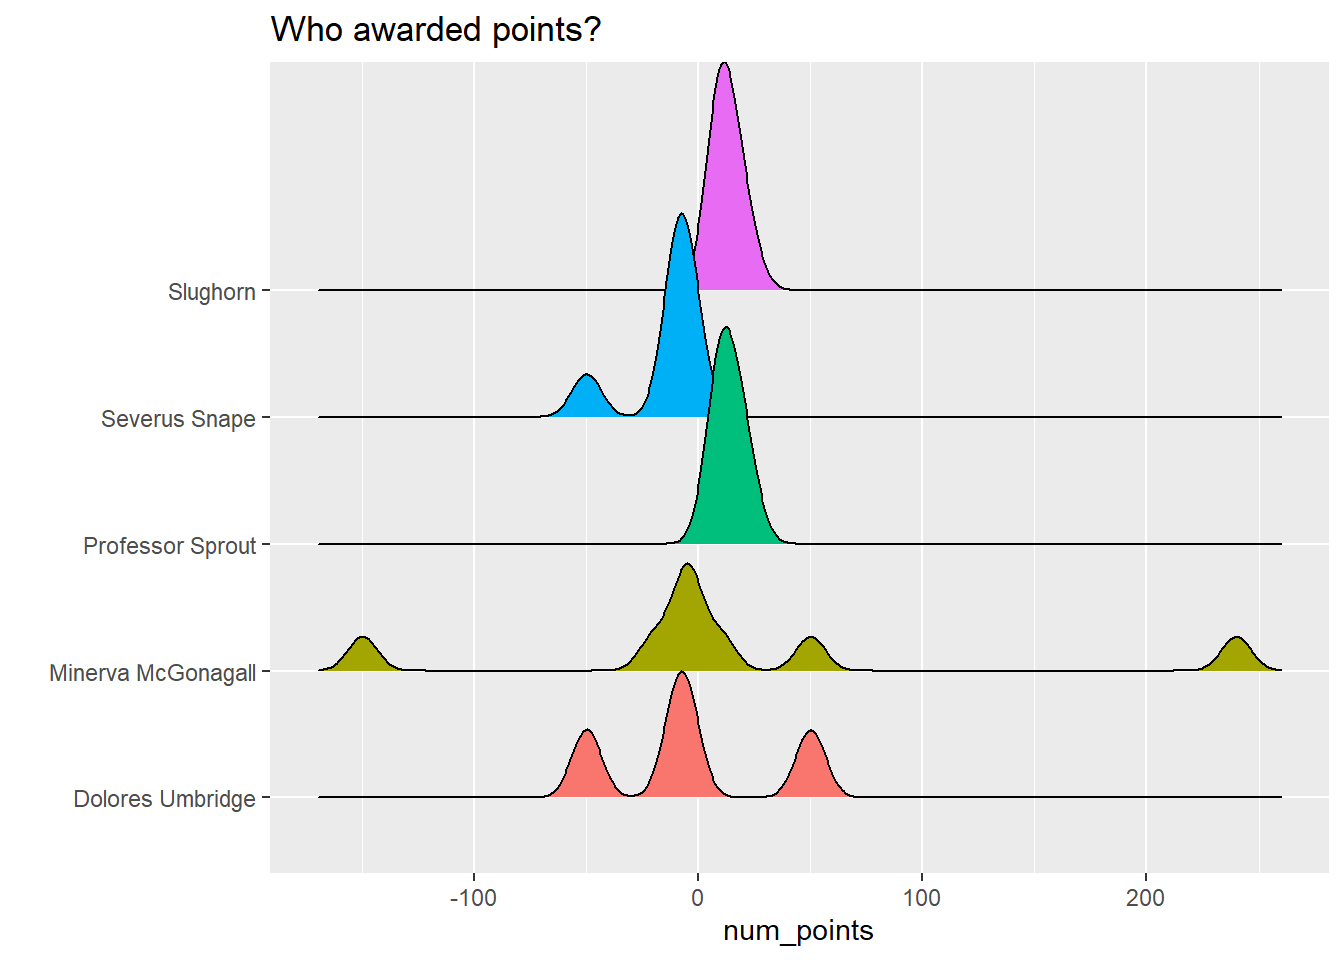
## hermione's correct answers
hp_points %>%
    filter(reason == "Correct answer",
           points_subject == "Hermione Granger") %>%
    group_by(points_awarder) %>%
    summarize(num_points = sum(num_points)) %>%
    ggplot(aes(reorder(points_awarder, -num_points), num_points, fill = points_awarder)) +
    geom_col() +
    theme(legend.position = "none") +
    labs(x = "", title = "Hermione's correct answers")
## `summarise()` ungrouping output (override with `.groups` argument)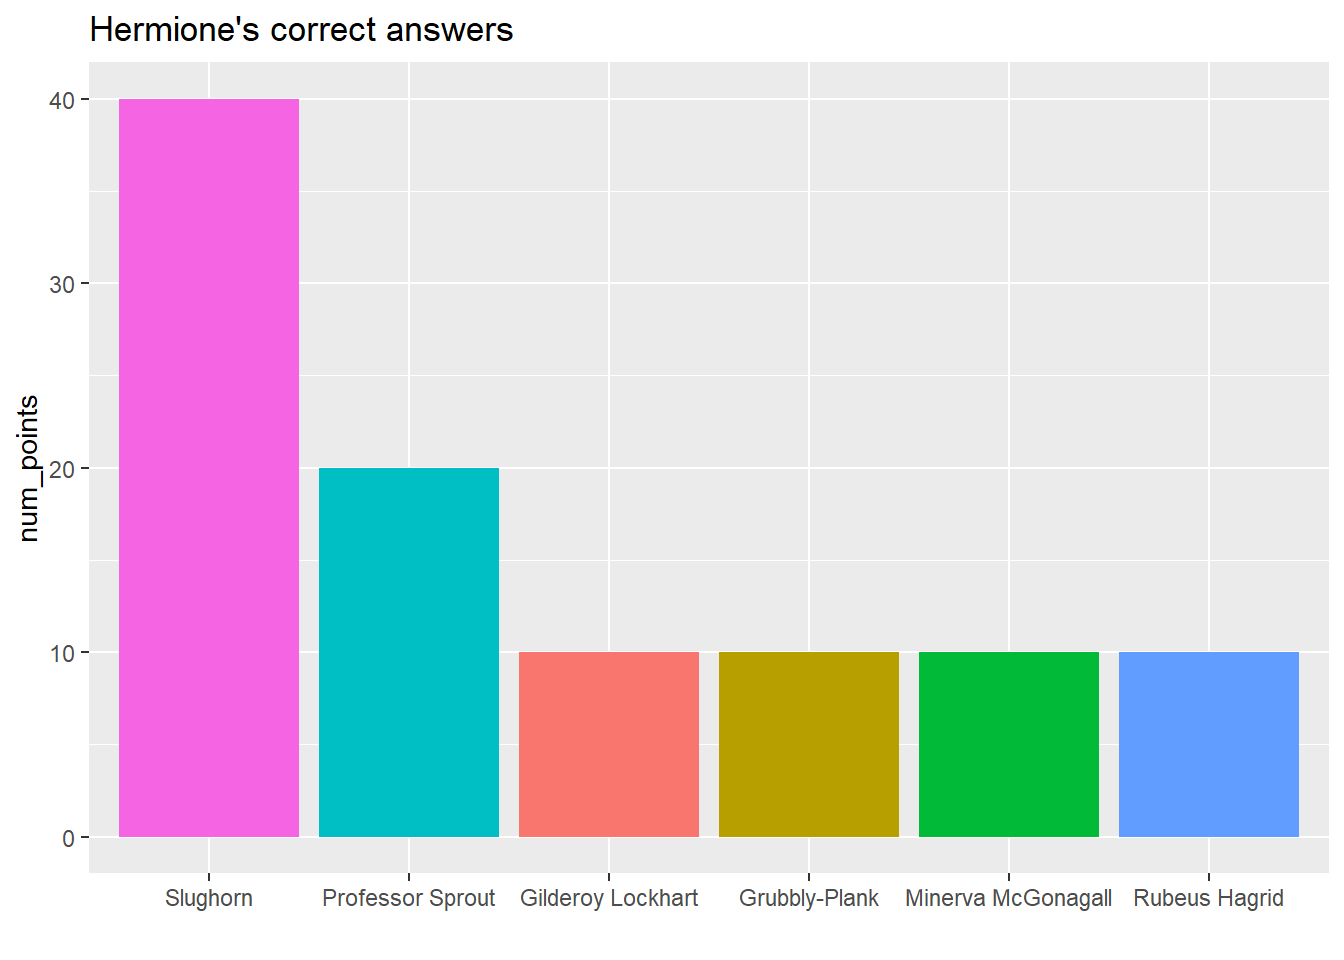
- Sorcerer’s Stone had a ton of negative point awards – many of them small, as did Order of the Phoenix (due to Umbridge). Goblet of Fire only had negative point awards!
- Most point awards or subtractions were small – 32/47 were between -10 and 10 points.
- Each book has a wide range of point awards. Sorcerer’s Stone, Chamber of Secrets, and Order of the Phoenix all had positive outliers due to end of the year adventure point awards. Notably, Sorcerer’s Stone also had a major negative outlier, with Professor McGonagall docking Neville, Ron, and Harry 50 points each (plus detentions!) for being out of bed after curfew (when Malfoy tricked them about a duel!).
- For reasons for the house point awards/subtractions, there were four basic reasons: Broken rules (being out of bed, being late, fighting), getting a correct answer in class, end of the year adventure awards, and either Umbridge or Snape being mean (where Harry and co didn’t exactly break a rule, but one of the two docked them points anyway). Note that Umbridge’s point awards were to Slytherin as part of Inquisitorial Squad stuff. It’s also noteworthy that attempting to win the cup by just getting correct answers will be tough – you have to answer a lot of correct questions due to small 5 or 10 point awards. It’s likely they’re more frequent than we see in the books (there are a lot of broken rules at Hogwarts!).
- McGonagall was loveable but stern – and that’s reflected in the distribution of point awards she gave/subtracted. Snape was basically all negative (point-wise), while Slughorn and Sprout both gave lots of points for correct answers (to Hermione!).
So really, the only weird point awards were the -50 points to Ron, Harry, and Neville in Book 1, and the single points that Snape docked Harry, also in Book 1. Everything else is pretty consistent!
Chad Peltier
My name is Chad Peltier and I the Head of Data & Integration for the US at Janes. I am interested in data science for social good, NLP, and GEOINT data.